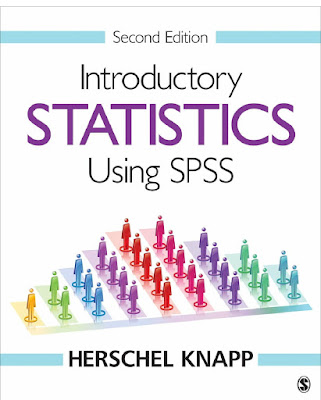
Introductionto spss book
Definition of statistical system Spss: it is one of the statistical applications that works to contain the Windows function, which is a set of rules and tools that can be through the way of entering the data that the scientific researcher through questionnaires, interviews or navigators, and then measurement by analysis (statistical analysis), the statistical system spss depends on digital information, and the program
Importance of the statistical system spss:
When collecting information and data related to scientific research methods, it requires some tools that contribute to the classification process, and then analysis, and access to the explanatory results of the research assumptions provided by the scientific researcher, and the Statistical System Spss is one of the most prominent tools that are used in this, where the program describes the variables, and thus generalize the The results in the shortest period of time and with minimal effort
Mode of operation of the statistical system spss:
The spss program is supplied with data by placing symbols that represent it, after which the appropriate test model of the data is selected, and the variables that the researcher wishes to analyze are determined
The list of commands in the statistical system spss:
The data editor includes a set of rows and columns, the rows represent cases, each row represents a specific number that represents that state, the columns represent research variables, it is possible to assign a column to each variable, and it is also possible for the user to change the style of the data editor in order to display the entered raw data, or display variables, and related labels such as names, numbers and letters, as well as the laboratory scale, both rank and nominally, as well as the values left by the researchers.
Data Display menu items:
File: this list can open, save and print files.
Edit: through that drop-down menu the values are copied, cut or pasted, as well as the options can be changed, reaching the data values.
View: through it the user can control the nature of the values and their annotations.
Transform modulation: used to calculate new variables according to the specified values.
Statistics ANALYZE: this list helps in obtaining a set of statistical tests and data analysis, and is considered one of the largest lists related to the presentation of data.
Data data: through it the data file can be changed completely.
Patterns GRAPHS: they are used to prepare graphs of all kinds, whether circular, rectangular, square or dots.
UTILITIES: data on variables can be obtained and controlled, as well as The Shape of the display screen.
Window WINDOWS: it is possible to switch between SPSS Windows.
Help: any query the user wishes to identify can be obtained through it.
Download introductory to spss book eup


تعليقات
إرسال تعليق